Estimating auto-scaled instance costs

This was originally posted under Bluecore Engineering’s Publication.
How can we reduce costs of running our code?
Every engineer has answered this question at some point in his/her career. My latest encounter with the question was in early 2017. After two quarters of engineering heads-down building product, it was time for us to assess the cost damage. Available at the time were daily billing reports provided by Google that we used to monitor costs and irregularities.
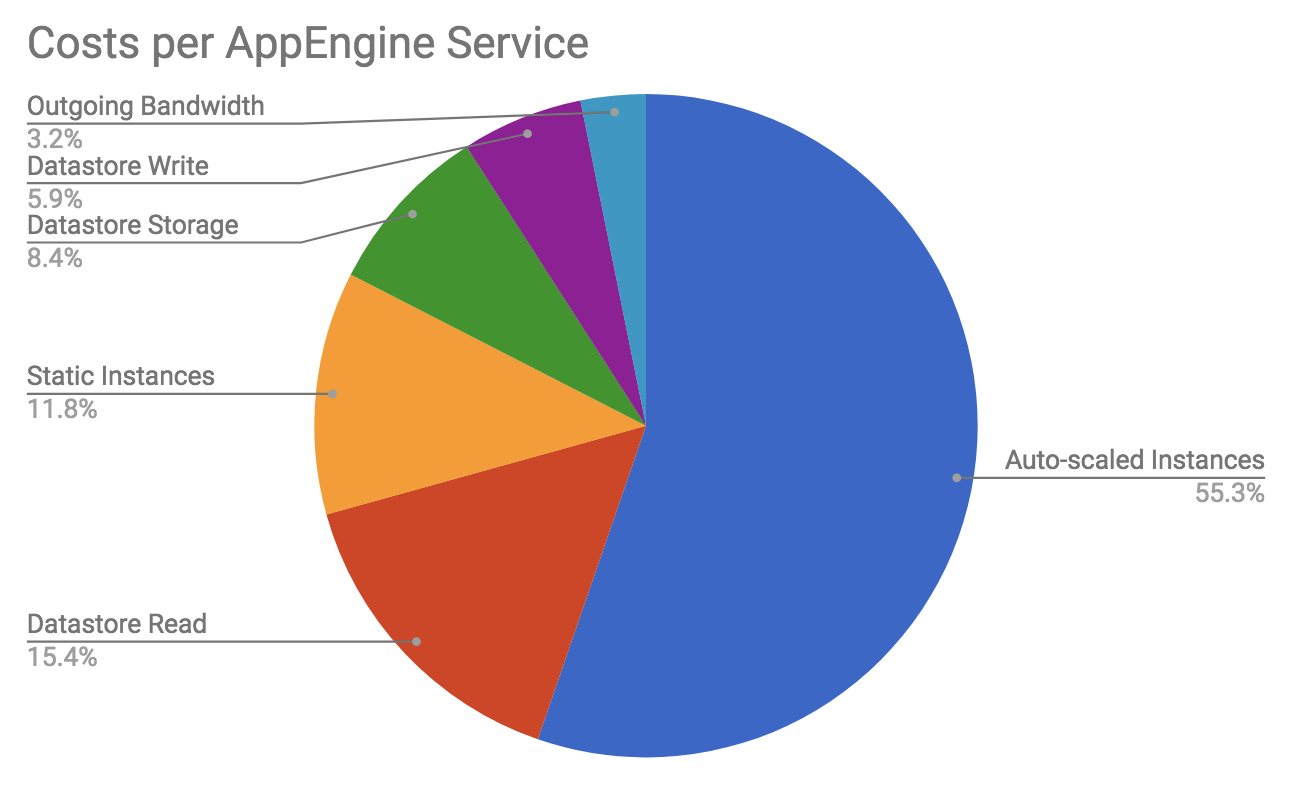
These reports were too high-level to derive optimization insights; however, they highlighted that most of our costs were due to auto-scaled instances. At Bluecore, every squad is responsible for a set of APIs, most of which run on these auto-scaled instances. As such, we weren’t surprised to find a large portion of costs were associated with them. In order to empower squads to investigate possible optimizations, we needed cost reporting at the API level. This meant that we needed to answer:
How much does it cost to run my code?
In this post we’ll step through some of the concepts about AppEngine’s auto-scaled instances, why it’s difficult to calculate costs for them and how we mixed various sources of data to provide good estimates on API-level costs.
Auto-Scaled Instances
The instance is the basic building block in AppEngine. It is the underlying server receiving and handling requests. AppEngine abstracts out management — starting/stopping/scaling — of instances behind a service. A service is distinguished by what API routes it handles and has configuration for:
Template for instances handling requests (e.g. 1GB memory)
Parameters to scale the instances up and down (e.g. max 50 concurrent requests)
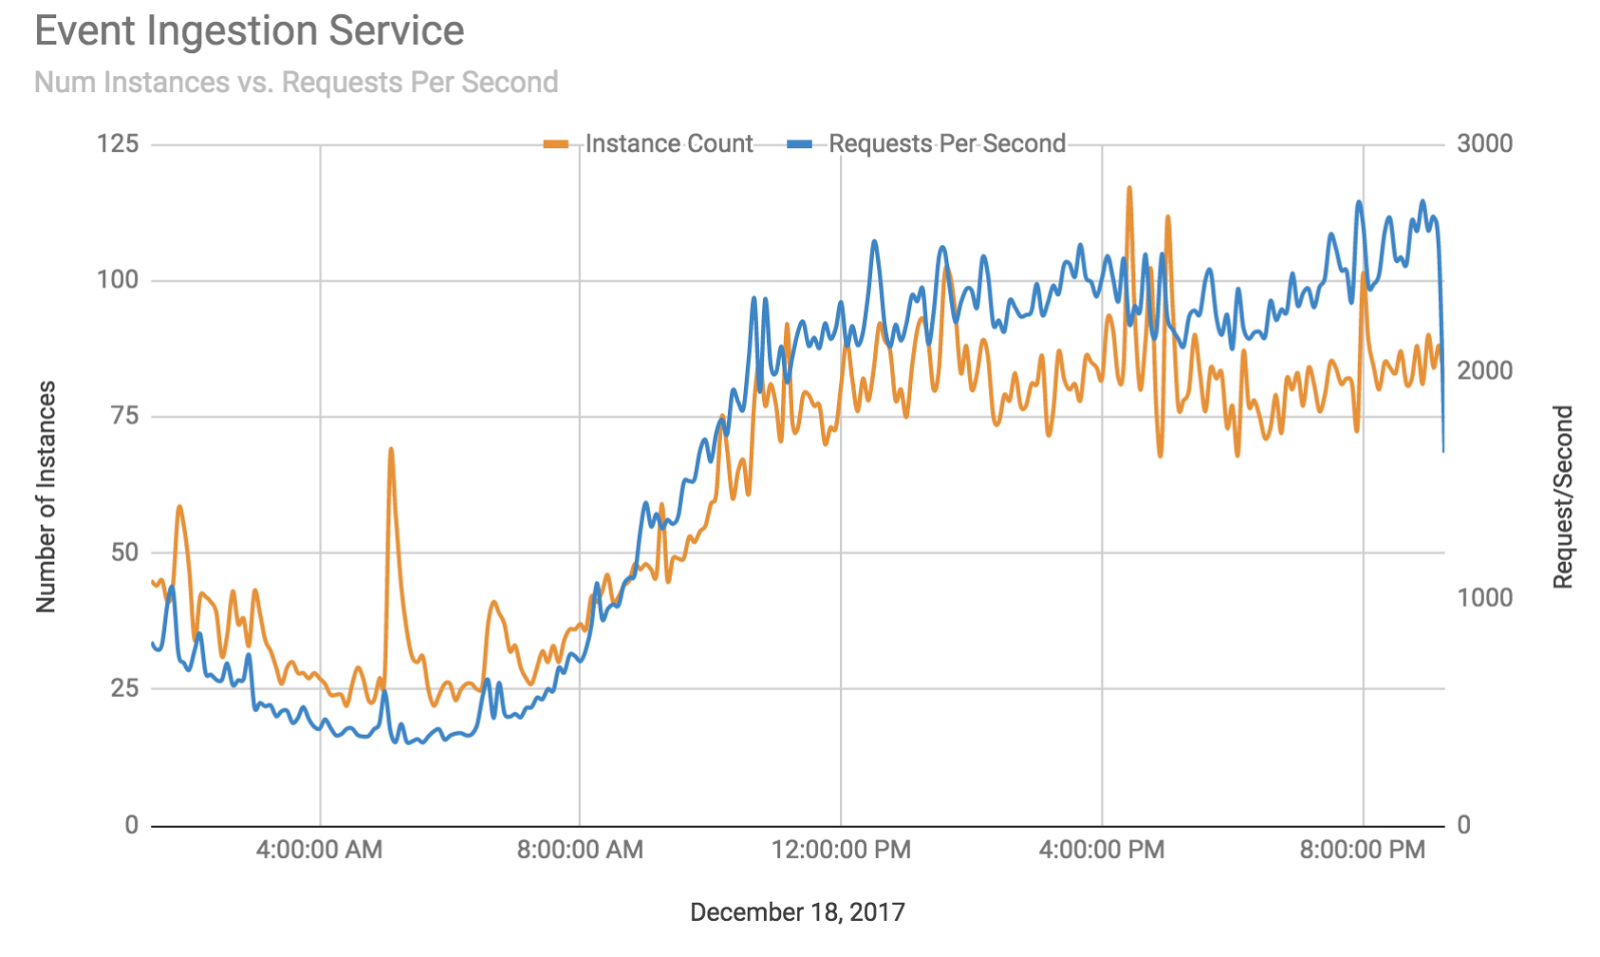
For example, let’s take our event ingestion service. It handles one specific API: /api/integration/event_ingestion. This service is tuned to have low-latency (<50ms) and as such we reduce the amount of concurrent connections and turn up the number of idle instances.
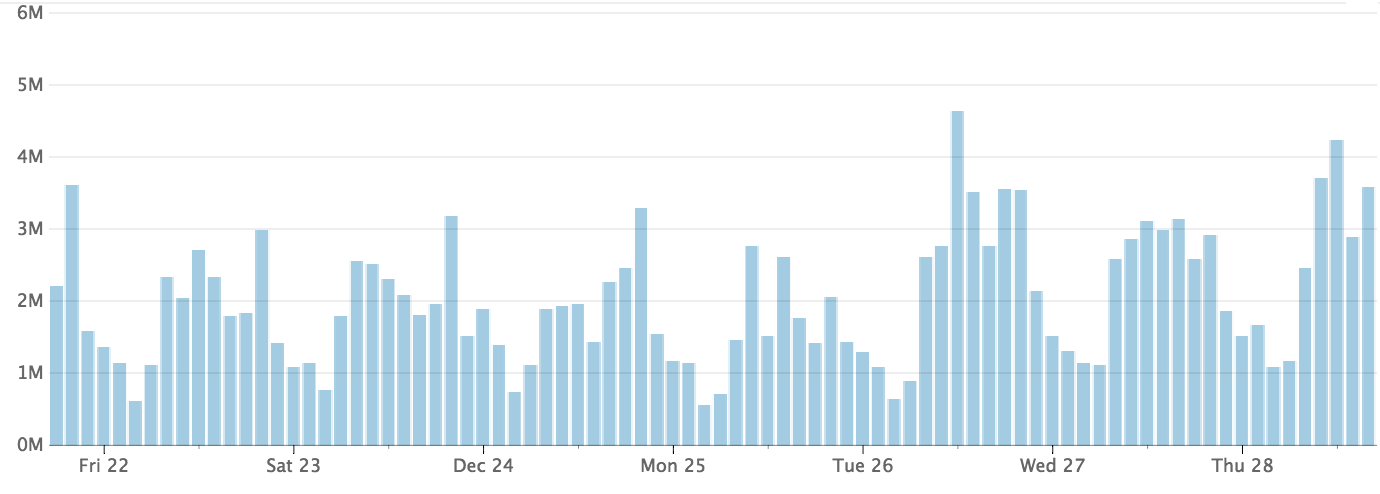
AppEngine automatically scales this service for us so that we don’t worry about the infrastructure. The following graph shows the number of requests handled by the event ingestion service compared to the number of instances running.
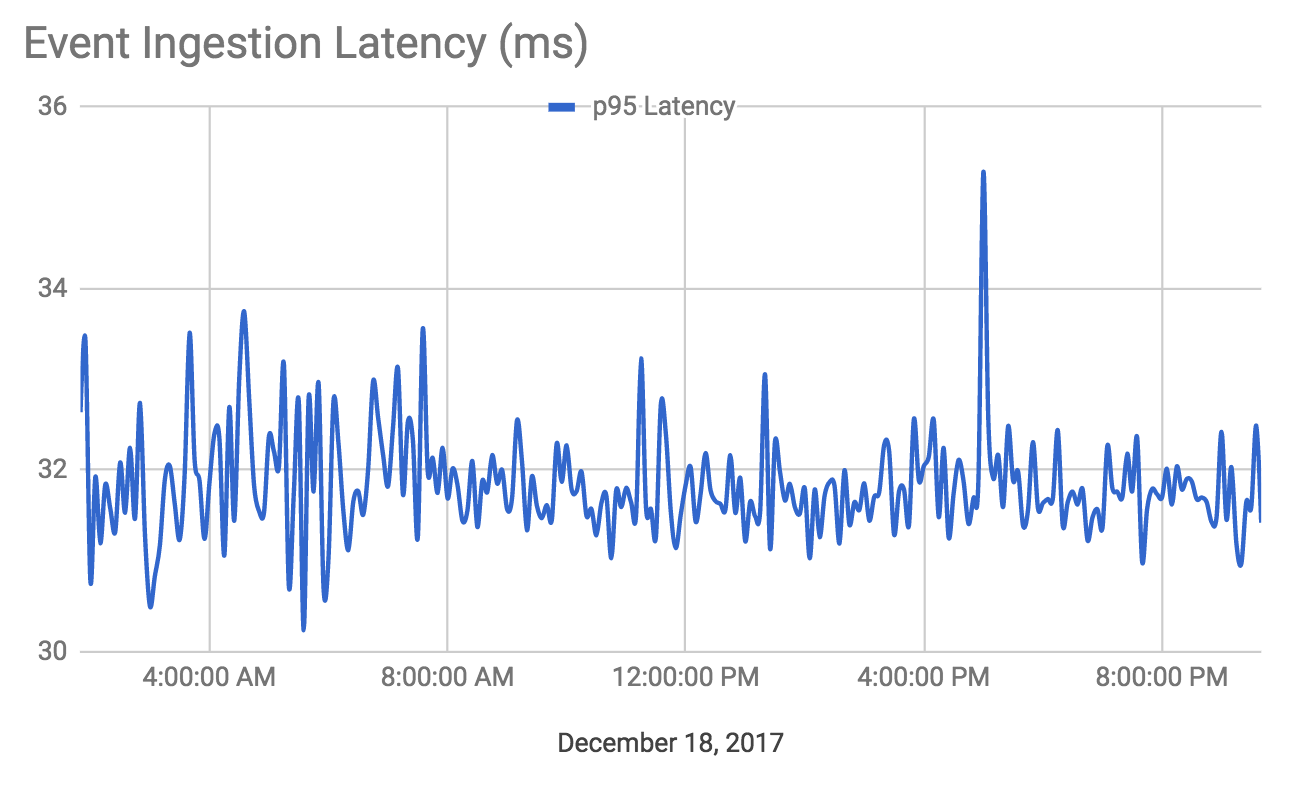
More importantly, the 95th percentile latency consistently stayed below 50 ms in this time period:
Cost of Instances
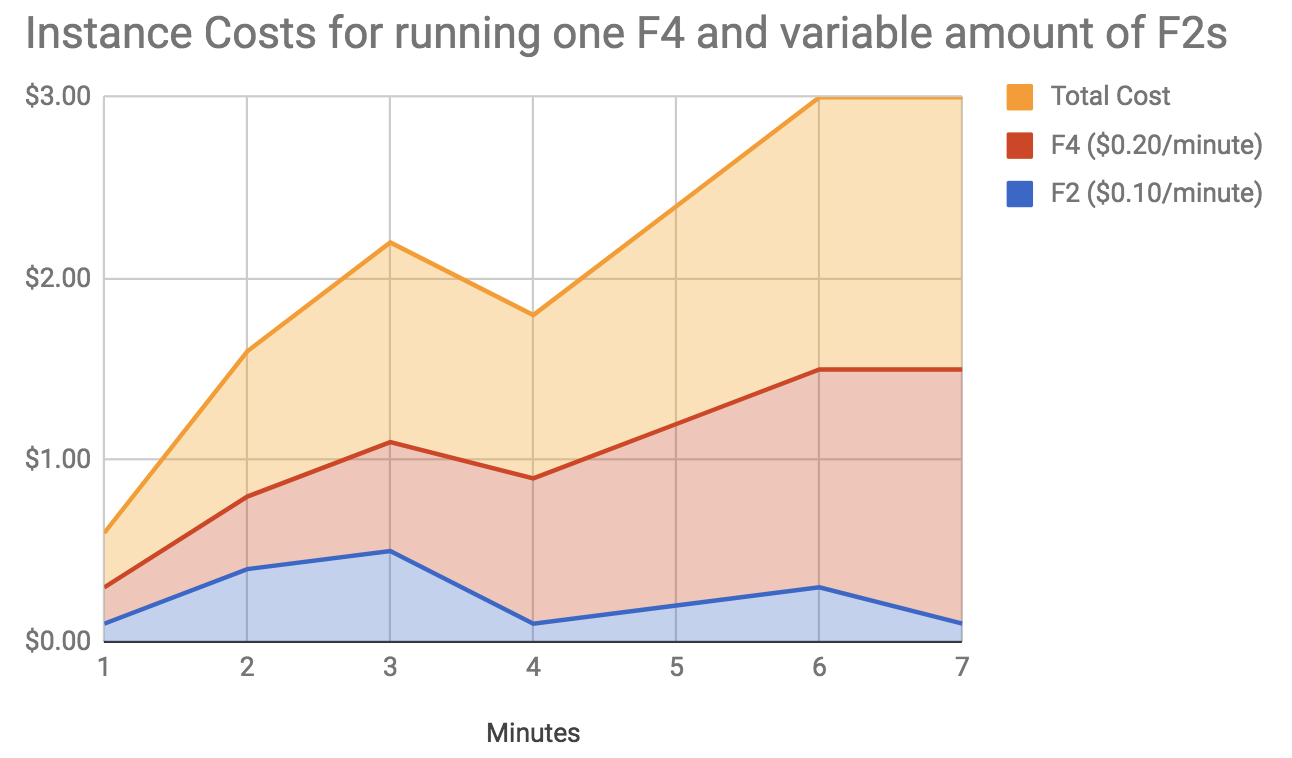
Google only bills for active instances and does so on a per-minute basis. An instance’s rate depends on it’s CPU/Memory capacity. For example, an F4 instance (512 MB memory 2.4 GHZ CPU) costs $0.20 per minute and an F2 instance (256 MB memory, 1.2 GHZ CPU) costs $0.10 per minute.
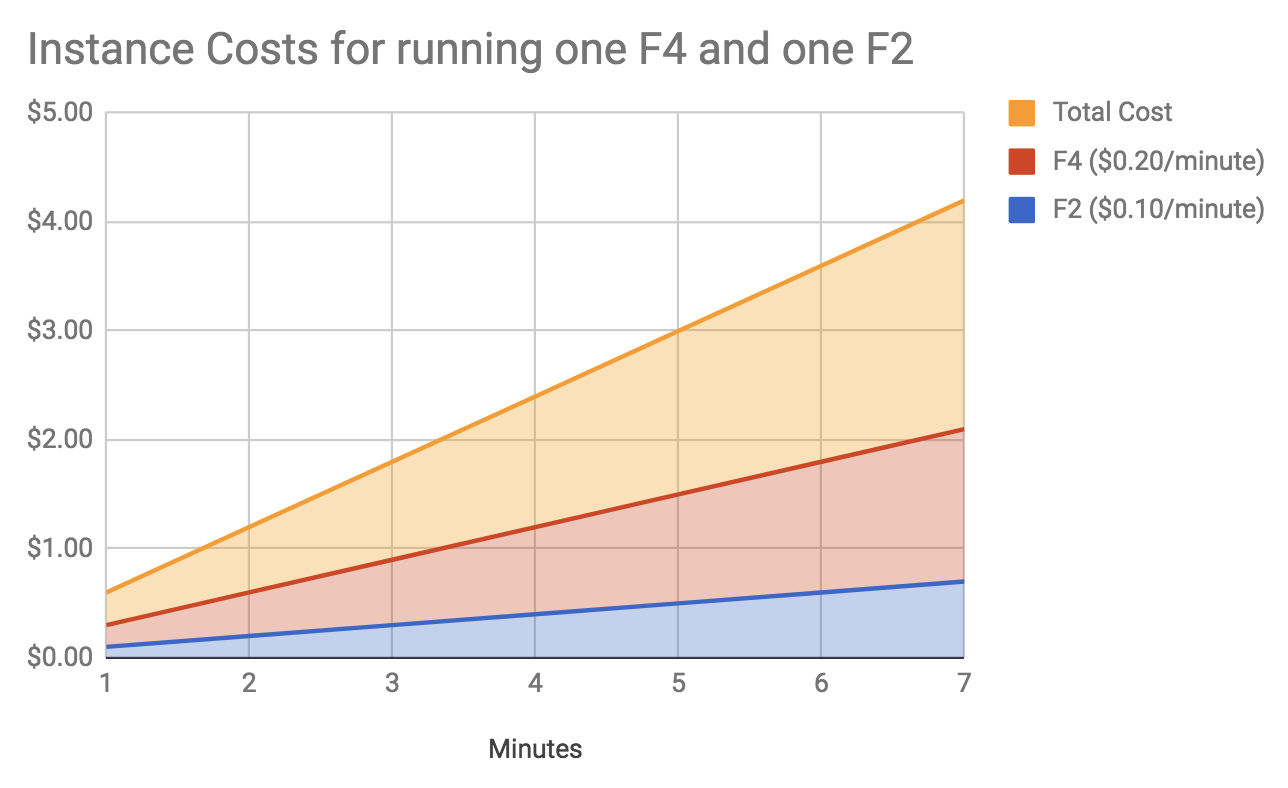
That being said, as these instances are scaled up and down throughout the day, it is difficult to say for sure how many instances are used as it depends on the traffic being handled. Revisiting the prior graph, you can imagine what that might look like:
APIs and Costs
Early in Bluecore history, engineers found that many APIs shared similar instance requirements (most run fine on F4s for example). To reduce the burden of managing/deploying too many services, we grouped APIs by their operational requirements (CPU/Memory). At the start of 2017, we had 231 APIs managed by 25 services. This meant that even if we could calculate the number of billed instances per service, we would not be able to directly tie it to an API.
The following is a graph of requests handled by one of our F4 services:
Number of Requests Handled
This service has over 50 APIs that vary in their CPU utilization and latency profiles. We needed a way to properly attribute instance utilization.
Logs to the Rescue
In order for us to provide API-level costs, we knew we’d need to dive into the request logs to stitch together information. AppEngine’s request logs are rich with information such as:
- Service Id
- Response code status
- URL Path
- Referrer
- Latency
At first, we thought we could simply use request times to estimate costs (the sum of all request times should be the amount of instance time spent processing the request), but that approach omitted the multi-threading feature of AppEngine (one instance can handle up to 50 requests).
Using only latency also had the problem of neglecting the different rates per instance type (F4/F2/F1/etc.): we would report that a one-second request on a regular F2 was cost-equivalent to a one-second request on a beefy F4. We wanted the F4 to be reported as 2x that of the F2 to reflect the rate difference. While looking in the logs for other metrics to leverage, we found “megacycle” — an integer that “corresponds to 1/1200 CPU second” (stackoverflow post). After experimentation, we observed that for a one-second request, the megacycle difference between an F4 and an F2 were 2 to 1 respectively.
To show this, I deployed a new API to an F2 and an F4 instance called /api/basic/demo_megacycles that prints an incrementing counter in the logs until 500 ms have passed. The endpoint simply runs the following python method:
import time
def execute(self):
start = time.time()
i = 0
while time.time() — start < 0.5:
print %s’ % (i + 2)
i = i +1
The megacycles reported were:
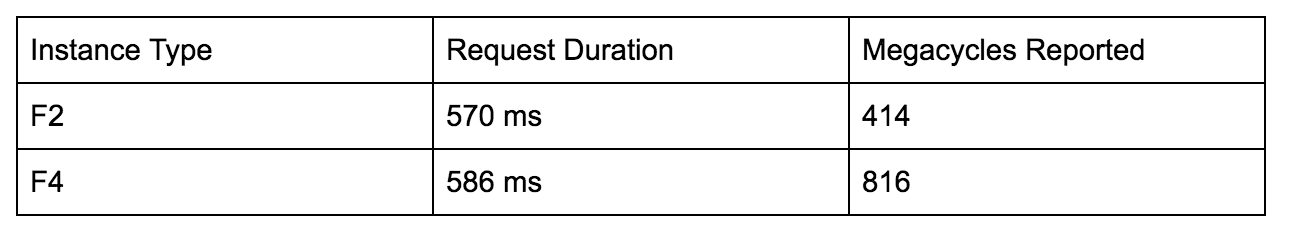
The megacycles line up very close to 2x different!
When we investigated using megacycles as a proxy for costs, our testing across similarly behaved APIs gave us intuitive values. It’s easy to spend too much time finding a perfect measurement, but we found “close-enough” allowed us to start providing value to the organization faster. When you find yourself trying to measure costs, don’t be afraid to ground your costs to something that isn’t perfect. Get data that enables action and then iterate on your measurements.
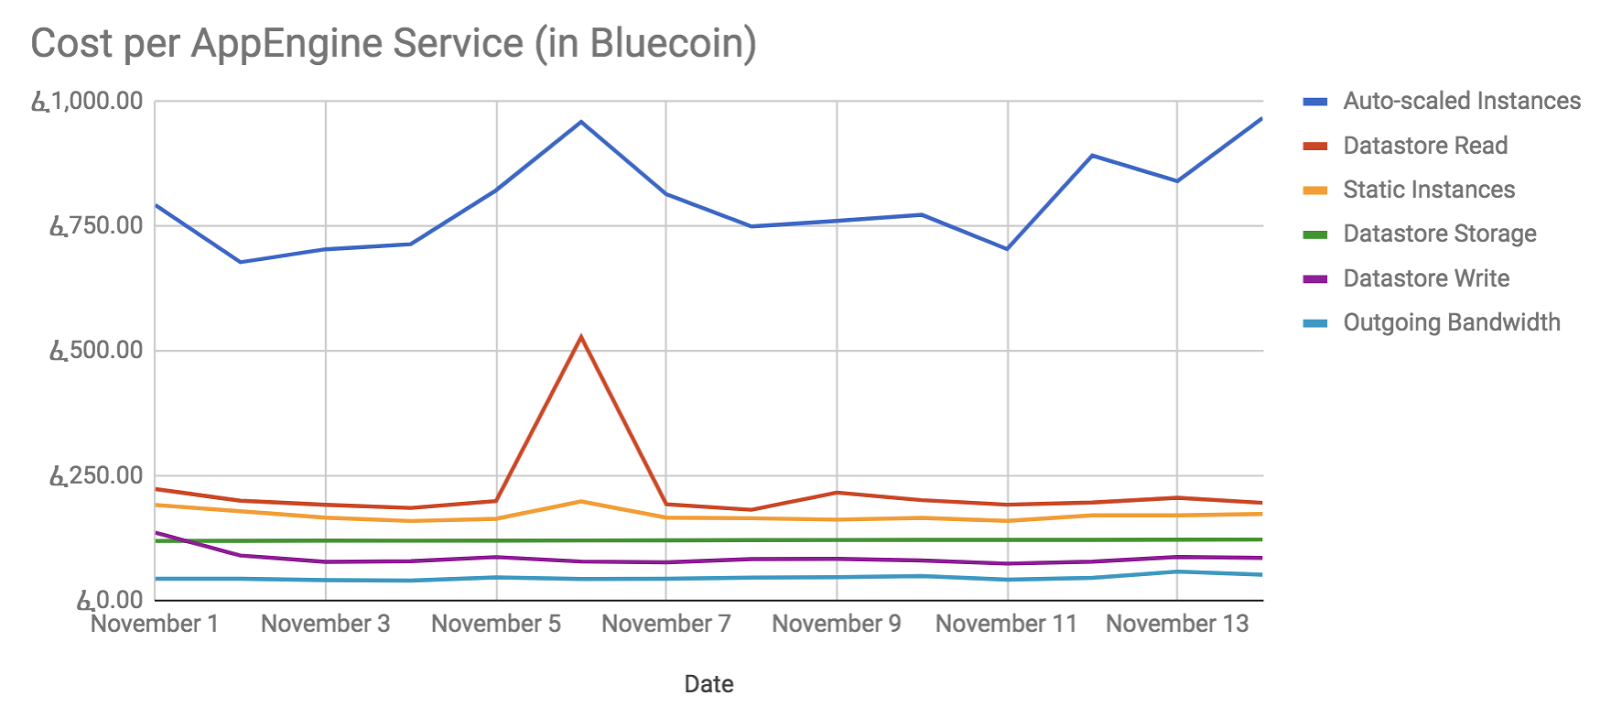
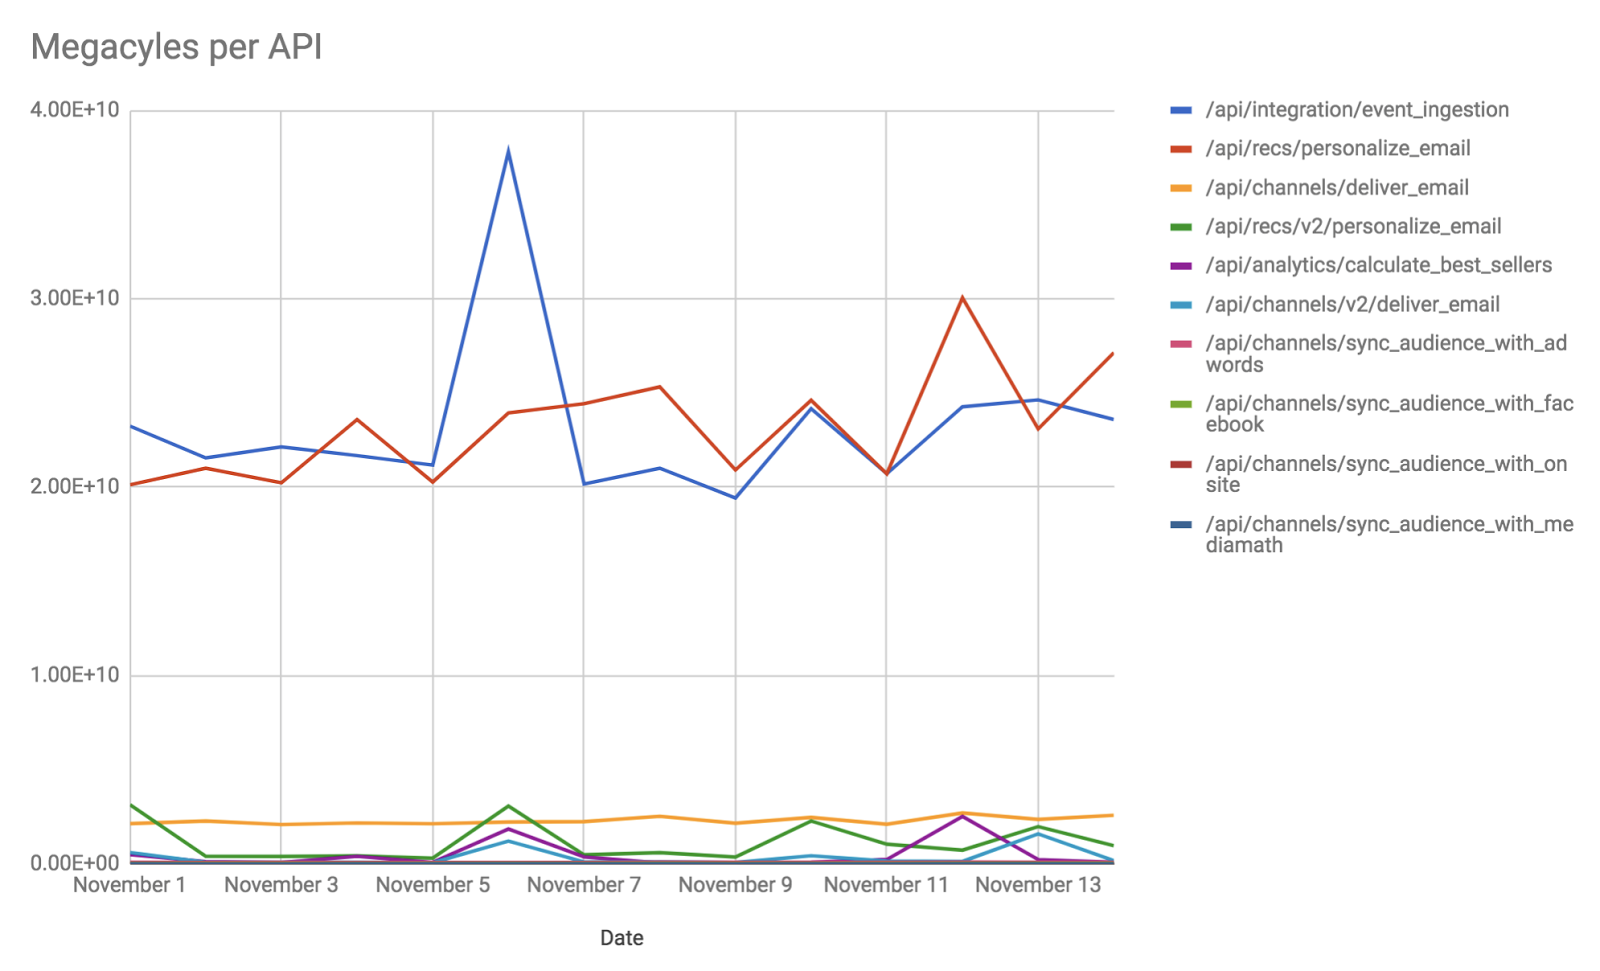
Ground your cost (imperfection is okay!) We needed access to these logs so that we could sum megacycles by API. Therefore, we exported our logs to BigQuery. A daily process would query BigQuery, extract megacycle and API data and send it to our analytics platform. Here is a look at the top 10 APIs in our megacycles-per-API graph:
Tying it All Together
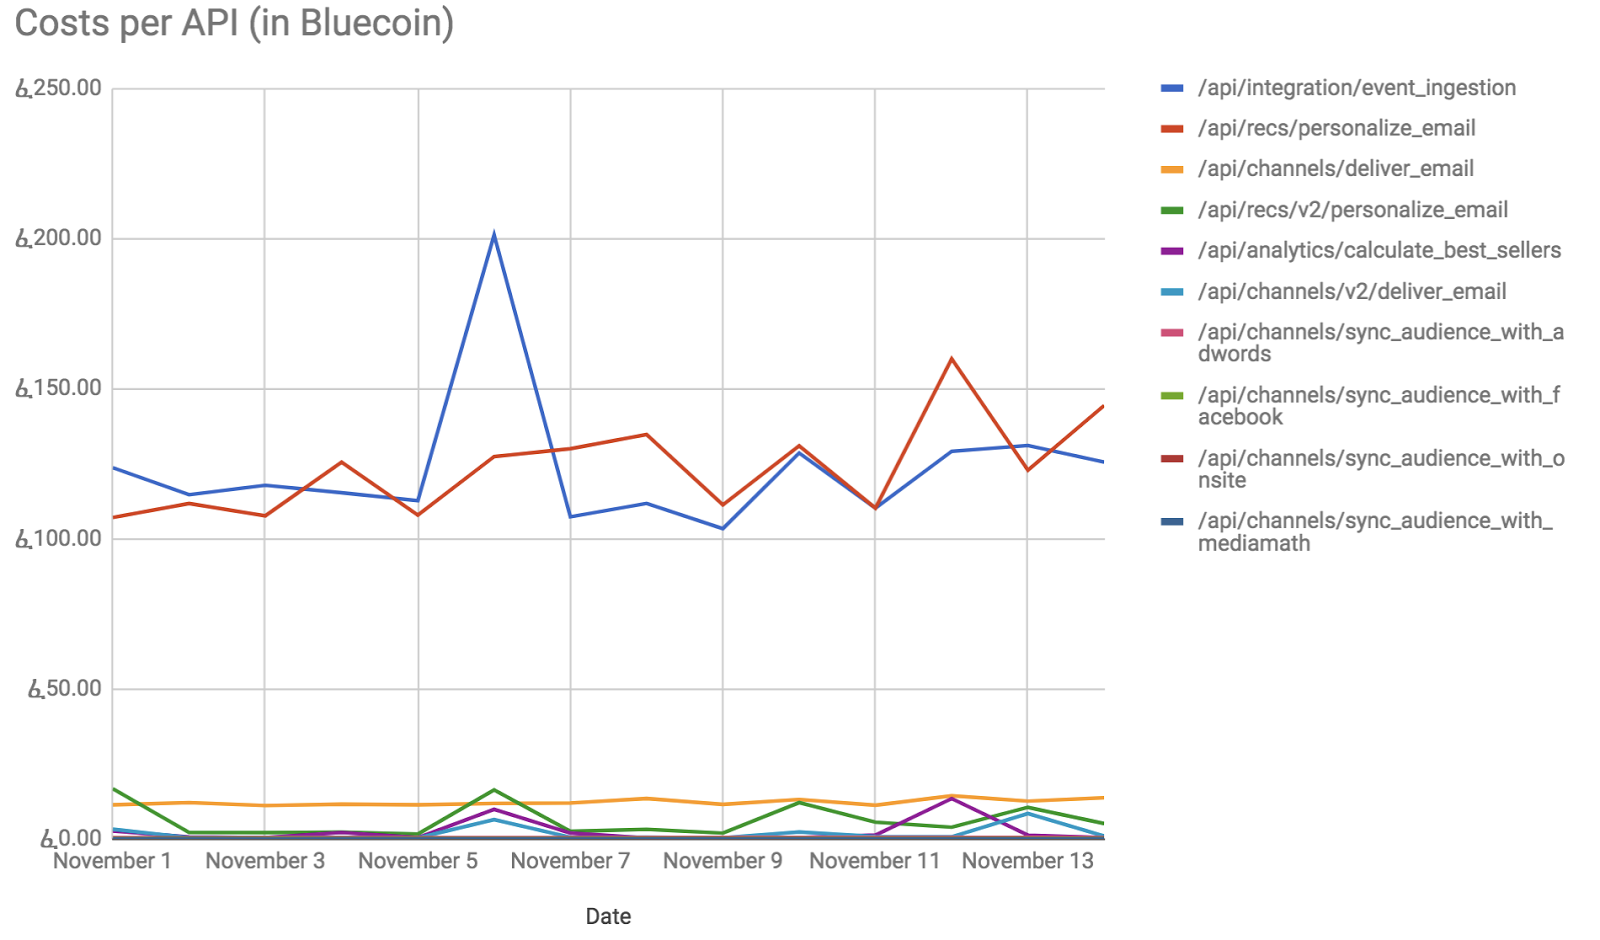
At this point, we had our daily costs for auto-scaled instances and a per-API megacycle count. In our analytics platform we then divided the daily auto-scale instance cost by the sum of accounted megacycles. With this rate, we could provide per API costs.
Measure, hypothesize and validate cost optimizations.
This cost graph has been instrumental in allowing us to measure, hypothesize and validate cost optimizations. Unexpectedly, they have been useful in identifying costly bugs as well. In March 2017, we found an API had a memory management bug by using the cost dashboard. The API would sporadically eat up too much memory and force more instances to scale up more than expected.
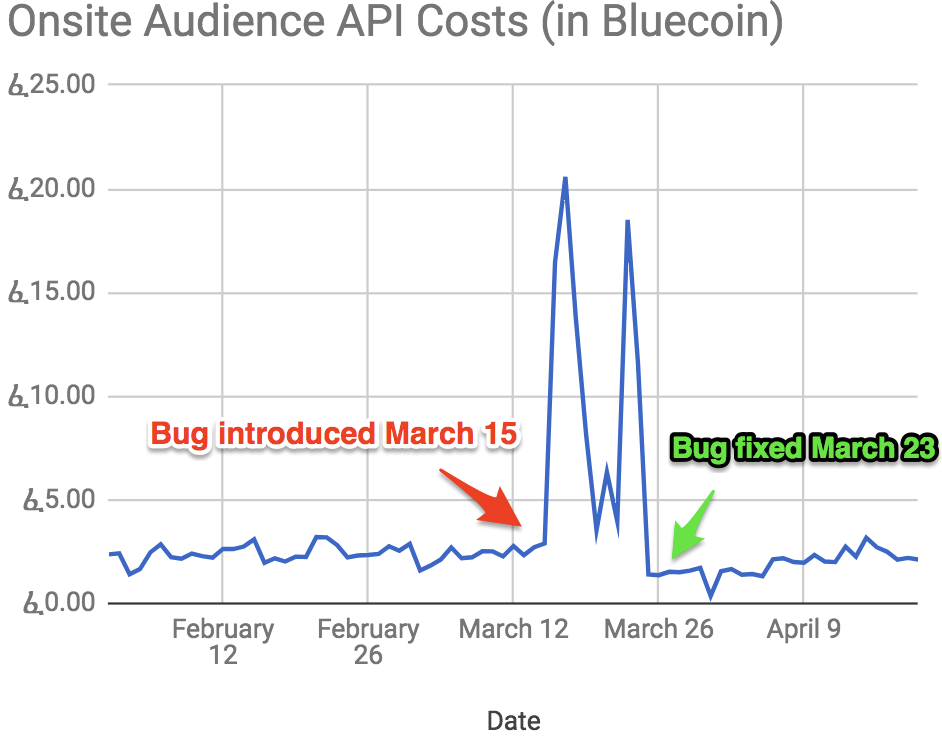
With this dashboard we were able to identify the issue, hypothesize a fix and validate that solution. The per-API dashboard has increased our engineers’ understanding of their code and empowered them to manage costs respectively. In the future, we would like to add automated alerts to catch situations like the bug described earlier.
If you find yourself needing to optimize your codes’ cost, you’ll need to:
- Find out what your code costs to run
- Ground your cost model (perfection optional)
- Measure, hypothesize, validate